Monte Carlo Integration
Reading time: 14 mins.If you understand and know about the most important concepts of probability and statistics in we introduced in Lesson 16, you will see that understanding Monte Carlo integration is incredibly simple. This method is used a lot in rendering (ray tracing in particular) and shading. In this chapter we will speak about the theory and in the next chapter we will actually study a practical example. To understand how MC integration is used in rendering, you first need to know about the rendering equation (which is the topic of the next lesson). We will then show how the method is used in the following lesson (Introduction to Light Transport).
Monte Carlo Estimator: Evaluating Integrals
Before you start reading this chapter, you must understand the law of the unconscious statistician which we explained in this chapter from lesson 16. It states that the expected value of a function of a random variable f(X) can be defined as:
$$E[f(X)] = \int f(X) P_X(X) \;dX.$$Where \(P_X\) is the probability distribution of the random variable X. This is hopefully something you understand well. If you don't, we strongly recommend that you carefully read the chapter which is devoted to this concept. You need to be perfectly comfortable with this idea to understand Monte Carlo integration.
At this point, you should also be familiar with the concept of variance and standard deviation which we won't talk about here (if you don't you will find them explained in lesson 16). However, as a quick reminder, recall that variance can be defined in two equivalent ways (the second is just slightly more convenient):
$$ \begin{array}{l} Var(X)& = & E[(X-E[X])^2],\\ & = & E[X^2] - E[X]^2. \end{array} $$We will be using these formulas further down, so it is also important that you understand them (they are explained in the lesson Mathematical Foundations of Monte Carlo Methods).
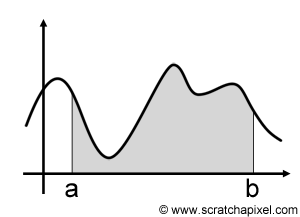
The principle of a basic Monte Carlo estimation is this: imagine that we want to integrate a one-dimensional function f(x) from \(a\) to \(b\) such as:
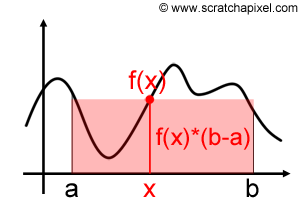
$$F = \int_a^b f(x)\;dx.$$As you may remember, the integral of a function f(x) can be interpreted as calculating the area below the function's curve. This idea is illustrated in figure 1\. Now imagine that we just pick up a random value, say x in the range [a,b], evaluate the function f(x) at x, and multiply the result by (b-a). Figure 2 shows what the result looks like: it's another rectangle (where f(x) is the height of that rectangle and (b-a) its width), which in a way you can also look at a very crude approximation of the area under the curve. Of course, we maybe get it more or less right. If we evaluate the function at x1 (figure 3) we quite drastically underestimate this area. If we evaluate the function at x2, we overestimate the area. But as we keep evaluating the function at different random points between a and b, adding up the area of the rectangles and averaging the sum, the resulting number gets closer and closer to the actual result of the integral. It's not surprising in a way as the rectangles which are too large compensate for the rectangles which are too small. And in fact, we will soon give the proof that summing them up and averaging their areas converges to the integral "area" as the number of samples used in the calculation increases. This idea is illustrated in the following figure. The function was evaluated in four different locations. The result of the function as these four values of x randomly chosen are then multiplied by (b-a), summed up, and averaged (we divide the sum by 4). The result can be considered an approximation of the actual integral.
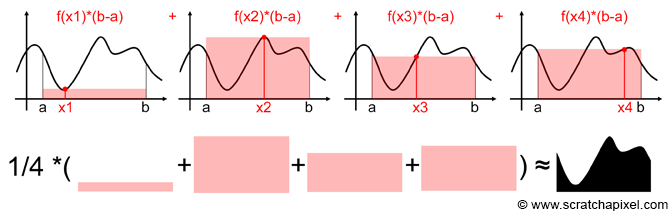
Of course, as usual with Monte Carlo methods, this approximation converges to the integral result as the number of rectangles or samples used increases.
We can formalize this idea with the following formula:
$$\langle F^N\rangle = (b-a) \dfrac{1}{N } \sum_{i=0}^{N-1} f(X_i).$$Where N here, is the number of samples used in this approximation. In mathematical notation (and statistics), \(\langle S \rangle\) represents the average of all the elements in S (\(\langle F^N \rangle \) is an approximation of F using N samples. It is equivalent to the sample mean notation \(\bar X_n\) we used in lesson 16 and the two are equivalent). This equation is called a basic Monte Carlo estimator. The random point in the interval [a,b] can easily be obtained by multiplying the result of a random generator producing uniformly distributed numbers in the interval [0,1] with (b-a):
\(X_i = a + \xi (b - a)\), where \(\xi\) is uniformly distributed between zero and one.
The PDF of the resulting \(X_i\)s is \({1}/{(b - a)} \). Since the random numbers are produced with equiprobability (each number is produced with the same probability as the others), we just divide 1 by the total number of outcomes as in the case of a dice. However in this example, the function is continuous (as opposed to discrete), so we divide 1 by the interval [a,b].
It is important here to note that:
$$Pr(\lim_{ N \to \infty} \langle F^N \rangle = F ) = 1.$$The law of large numbers which we talked about in the lesson Mathematical Foundations of Monte Carlo Methods, tells us that as N approaches infinity, our Monte Carlo approximation converges (in probability) to the right answer (the probability is 1).
Note also that \(\langle F^N \rangle\) is a random variable since it's made up of a sum of random numbers. We can now proof that the expected value of \(\langle F^N \rangle \) is equal to F:
$$ \begin{array}{l} E[\langle F^N \rangle] & = & E \left[ (b-a) \dfrac{1}{N } \sum_{i=0}^{N-1} f(x_i)\right],\\ & = & (b-a)\dfrac{1}{N } E[f(x)],\\ & = &(b-a)\dfrac{1}{N} \sum_{i=0}^{N-1} \int_a^b f(x)pdf(x)\:dx\\ & = & \dfrac{1}{N} \sum_{i=0}^{N-1} \int_a^b f(x)\:dx,\\ &=& \int_a^b f(x)\:dx,\\ &=&F\\ \end{array} $$Remember that the pdf is equal to 1/(b-a) thus it cancels out the term (b-a) on the right inside of the integral sign (line 3).
Generalization to Arbitrary PDF
Now, as mentioned above, the formula we used for the Monte Carlo estimator is basic. Why? Because it only works if the PDF of the random variable X is uniform. However, we can extend Monte Carlo integration to random variables with arbitrary PDFs. The more generic formula is then:
This is the more generalized form of the Monte Carlo estimator and the one you should remember (if there's only one equation to remember from the last two chapters, it is the one).
To be clear, the pdf in the denominator is the same as the pdf of the random variable X.
As with the basic Monte Carlo estimator, to be sure that this formula is valid, we need to check that this estimator has the correct expected value. Let's check:
$$ \begin{array}{l} E[\langle F^N \rangle ] & = & E \left[ \dfrac{1}{N } \sum_{i=0}^{N-1} \dfrac{f(X_i)}{pdf X_i)} \right],\\ & = & \dfrac{1}{N} \sum_{i=0}^{N-1} E\left[ \dfrac{f(X_i)}{pdf(X_i) }\right],\\ & = & \dfrac{1}{N} \sum_{i=0}^{N-1} \int_\Omega \dfrac{f(x)}{pdf(x)} pdf(x)\;dx, \\ & = & \dfrac{1}{N} \sum_{i=0}^{N-1} \int_\omega f(x) \; dx, \\ & = & F. \end{array} $$The trick here is in the substitution of (line 2):
$$E \left[ f(X_i) \right],$$for (line 3):
$$E[f(x)] = \int_{\Omega} f(x) pdf(x) \;dx.$$on the third line (and not forget to divide f(x) by pdf(x)). Take the time to understand these equations. As we just said, this is the most important result of everything we have studied so far and is the backbone of almost every algorithm we are going to study in the next lessons. If you don't understand this algorithm, you won't understand Monte Carlo ray tracing. With the rendering equation, this is probably the second most important equation. Now, you will ask why would I ever want to draw samples from any other distribution than a uniform distribution? And that would be a very good question. The weak answer is "because maybe you can only use a given random generator to produce samples and that this generator has a non-uniform PDF". Thus, at least, if that's the case, we just demonstrated that you can still use a Monte Carlo integration, as long as you don't forget to divide \(f(X_i)\) by \(pdf(X_i)\). But you will also see that this result will become handy when we will study variance reduction in the next chapter. So keep reading and you will soon understand why this result is important!

Let's get an intuition as to why dividing f(x) by pdf(x) is necessary (for non-constant PDFs). As you know, the pdf gives the probability that a random variable X gets some value \(x_i\). When you draw samples from an arbitrary PDF, samples aren't uniformly distributed: more samples are generated where the PDF is high and reversely, fewer samples are generated where the PDF is low (see adjacent figure). In a Monte Carlo integration though, the samples need to be uniformly distributed. If you generate a high concentration of samples in some regions of the function (because the PDF is high in this region), the result of the Monte Carlo integration will be biased.
Dividing f(x) by pdf(x) though will counterbalance this effect. Indeed, when the pdf is high (which is also where more samples are generated) dividing f(x) by pdf(x) will decrease the "weight" of these samples in the sum. So in essence, we compensate for the higher concentration of samples, by weighting down their contribution. On the other hand, when the pdf is low, fewer samples are generated (the density of samples is lower than in the region where the pdf is high). But if we divide f(x) by a low value (1 divided by 0.1 for instance), the contribution of these samples is scaled up. We compensate for the lesser density of samples by giving them more weight.
That's in essence, what the division of f(x) by pdf(x) does. It weights the samples' contribution to compensate for the fact that samples generated from an arbitrary PDF won't be uniformly distributed (assuming the PDF is not constant of course): it scales down samples generated in regions of higher density (where the PDF is high), and scales up samples generated in regions of lesser density (where the PDF is low).
We look into this concept in depth in the next chapter on variance reduction and importance sampling.
Properties of Monte Carlo Integration
As you can see, a Monte Carlo estimation is nothing else than a sample mean, only, we substitute the population for a real-value arbitrary function. For this reason, Monte Carlo estimations and sample means to share the same properties:
-
A Monte Carlo estimation converges to the function f(x) expected value, as the sample size approaches infinity. This is, as you can guess, a very important property. It says, as with the sample mean, that the higher N, the more likely we are to converge, in probability, to the correct answer (F).
\(\text{Pr} \left\{ \lim_{N\to\infty} \langle F^N \rangle = F \right\} = 1\).
-
A Monte Carlo estimator is unbiased and consistent.
-
Its rate of convergence is proportional to the function's variance \(\sigma^2\). The variance of the estimator is itself the now familiar formula: \(\sigma^2 / n\). In practice, this means that four times more samples are needed to reduce the error of the estimate by half.
-
The Central Limit Theorem (CLT) establishes the asymptotic distribution nature of the estimate. In other words, \(\bar X_n\) has a normal distribution.
Some additional remarks can be made. The random variables \(X_i\) are of course random which also means that the sample mean \(\bar X_n\)/\(\langle F^N \rangle\) is random. Furthermore each time you will run the estimation (or simulation) you will get a different value for \(\bar X_n\)/\(\langle F^N \rangle\).
Advantages of Monte Carlo Integration over Deterministic Methods
The idea behind the Monte Carlo estimator is simple and has probably been known for a very long time, but it only took off with the advent of computer technology in the late 1940s. Evaluating functions a great number of times and averaging the results is a task a computer can do countless times faster than what we, humans, could ever achieve. Being able to run these simulations efficiently (something we never had a chance to do before the computer age), helped solve a great number of important and complex problems in numerous fields of science (mathematics, physics, biology, chemistry, etc.). It can also be applied to other areas such as finance (to run predictions) and of course computer graphics. We will talk about this more in a moment.
However, you may wonder why we would be interested in this technique at all. Indeed, in the chapter on the Mathematics of Shading, we learned how to calculate integrals using a technique called the quadrature rule (check the section on the Riemann sum for example). This technique is quite simple as well. So why would you be interested in another method? It happens that quadrature rules to solve integrals are simple indeed, but as the dimension of the integral increases, they become more and more expensive to use. In fact, they suffer from the curse of dimensionality, where the convergence rate becomes exponentially worse as the dimension of the integral increases (they require \(N^d \) samples for d-dimensional integral).
Example of a multiple integral: \(\int \cdots \int_D f(x_1, x_2, \cdots, x_n) dx_1 \cdots dx_n\).
On the other hand, the principle of the Monte Carlo integration can easily be extended to a higher dimension and the convergence rate of the method is independent of the number of dimensions. As you will see in the next lessons, in rendering we sometimes have to solve integrals of functions with many variables (or multiple integrals) for which MC integration is better suited. Of course, for a fixed number of samples, the quality of the approximation decreases with the number of dimensions but still, you are guaranteed to get a solution at a fixed cost (the number of samples N).
One of the key elements of a Monte Carlo estimation is the ability to use and thus generate sequences of random numbers which we can use to evaluate the function f(x) for "random" values of x over the desired interval [a,b]. Thus as with all the other methods, the generation of random numbers. In this chapter, we will only consider the case where these numbers are generated with a uniform distribution, but in some cases, it is advantageous to generate random numbers with very specific PDFs. We will explain why later in this chapter and the lesson on importance sampling. However, the point here, is that mastering the art of generating random numbers, is very important if you wish to use Monte Carlo methods. A chapter of this lesson is dedicated to this topic.
Improving Monte Carlo Integration: Variance Reduction
In this chapter, we have only presented the basic Monte Carlo estimator. This naive method works well for simple cases, but we are interested in using it for practical problems which are generally more complex. As we explained before the problem with Monte Carlo integration is its convergence rate which despite being constant is also pretty low (\(O\sqrt{N}\)). For this reason, a lot of research went into developing techniques to reduce the error (or variance). We often speak of variance reduction. Importance sampling for instance, which is a term you may have heard of already, is an example of such a strategy.
Summary
Let's summarize what we have learned about the Monte Carlo integration method.
Advantages:
-
Simplicity (adapts well to multi-dimensional integrals).
-
Unbiased and consistent.
-
Parallel nature: each processor of a computer can be assigned the task of making a random trial (at least processing trials in batches) and thus work on solving an integration in parallel.
Disadvantages:
-
Slow rate of convergence.
-
Difficult to evaluate the variance of the function f(x), and hard to know what the error of the approximation is.