Perlin Noise
Reading time: 21 mins.This is the second part of a series of lessons devoted to generating procedural noise patterns. If you are not familiar with the subject yet, we recommend you to read the lesson Value Noise and Procedural Pattern: Part1 first.
Perlin Noise
In 1985, Ken Perlin wrote a Siggraph paper called "An Image Synthesizer", in which he presented a type of noise function similar to the one we studied in the previous lesson (Noise Part 1) but slightly better. This noise function was improved and extended over the years, primarily by Ken Perlin and others. We will study some of these improvements in this lesson. This noise function is now known under the name of Perlin Noise.
The Perlin noise is very similar to the type of noise we studied in the previous lesson. Similarly to the value noise, it relies on a lattice system. At the corner of the lattice system's cells, we define random values, which are then interpolated to compute a noise value at the location of a point in space. In the previous lesson, we studied the creation of 1D and 2D value noise. In this lesson, we will implement the 3D version of the Perlin noise function. The takeaway is that the value and Perlin noise are lattice-based noise functions.
So if they work on the same principle, what's the difference? The difference is how we compute the "random values" at the corners of the lattice. In the case of the value noise, we assign random numbers at the corners of the lattice cells and interpolate these values using the position of the point within the cell that point falls into. This process is well explained in the previous lesson. In the Perlin noise, Ken Perlin suggests replacing the random values at the cell's corners with gradients. He calls gradients just random 3D normalized vectors (in the case of the 3D version of the noise function). This is not very complicated to generate. Rather than generating random numbers within our Noise function constructor class, we replace the random float generation with a random 3D vector generation. Creating a 3D random vector is easy: generate three random floats in the range [0,1], remap these random numbers in the range of [-1,1], and then normalize the resulting vector coordinates.
unsigned seed = 2016;
std::mt19937 generator(seed);
std::uniform_real_distribution<float> distribution;
auto dice = std::bind(distribution, generator);
float gradientLen2;
for (unsigned i = 0; i < tableSize; ++i) {
    gradients[i] = Vec3f(2 * dice() - 1, 2 * dice() - 1, 2 * dice() - 1);
    gradientLen2 = gradients[i].length2();
    gradients[i] /= sqrtf(gradientLen2);  //normalize gradient
    permutationTable[i] = i;
}
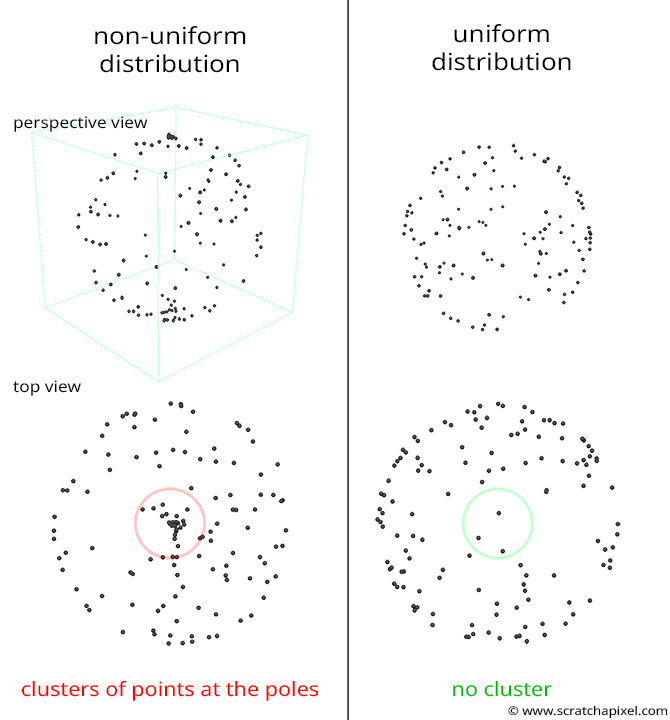
There is a slight problem with this approach though. Generating random normalized directions uniformly distributed is the same as generating random positions on the unit sphere with a uniform distribution. The problem with the approach described above is that it generates random normalized directions, but these directions are not uniformly distributed over the surface of a sphere. Not all directions are equally drawn: our noise won't be uniform, and we don't want that. But let's ignore this point for now; we will correct this problem later.
Rather than having a random number of interpolating at the corner of the cells, we now have gradients or vectors. And since the noise function returns a real value, how do we go from a 3D vector to a real value again (aka float or double in code terms)? Ken Perlin suggested computing directions between the position of each corner of the cell to the point P, at the position of which we wish to evaluate the noise function. This provides us with 8 vectors in 3D and 4 in the 2D case (a cube has 8 corners or vertices). He then used a dot product between the gradient at the corner of a cell and the vector from that corner to P. Since the dot product of two vectors gives a real number, here it is; we managed to convert our gradients or directions to some random numbers again. As with the 2D case, to compute the coordinates of the point P in the local coordinate of our "fictitious" 3D grid, we will cast the point coordinates from float to integer values and then take these integer coordinates modulo N, the size of our random directions' array (as in the lesson on value noise we chose N = 256). We explained in the previous lesson all these techniques (including how we can replace the C++ operator modulo % with the binary operator & if the size of that table is a power of 2). As we also explained in the previous lesson, we don't want to generate a lattice of 256x256x256 directions. So we use a single 1D array of 256 random directions and use the technique of the permutation table to "randomly pick up" one of the directions stored in this table by converting the integer coordinates of the point into an index into that permutation table with a hash function. Once again, all these techniques are explained in the previous lesson.
Now that we know how to convert the 8 directions at the corner of the cell into 8 signed random values (they are random since the directions at the corner of the cell were chosen randomly), all there is to do then is to linearly interpolate these values using trilinear interpolation (in the 3D case and bilinear interpolation in the 2D case). Bilinear and trilinear interpolation is explained in the lesson on Interpolation.
class PerlinNoise
{
    static const unsigned tableSize = 256;
    static const unsigned tableSizeMask = tableSize - 1;
    Vec3f gradients[tableSize];
    unsigned permutationTable[tableSize * 2];

    PerlinNoise()
    {
        unsigned seed = 2016;
        std::mt19937 generator(seed);
        std::uniform_real_distribution<float> distribution;
        auto dice = std::bind(distribution, generator);
        float gradientLen2;
        for (unsigned i = 0; i < tableSize; ++i) {
            do {
                gradients[i] = Vec3f(2 * dice() - 1, 2 * dice() - 1, 2 * dice() - 1);
                gradientLen2 = gradients[i].length2();
            } while (gradientLen2 > 1);
            gradients[i] /= sqrtf(gradientLen2);  //normalize gradient
            permutationTable[i] = i;
        }

        std::uniform_int_distribution<unsigned> distributionInt;
        auto diceInt = std::bind(distributionInt, generator);
        // create permutation table
        for (unsigned i = 0; i < tableSize; ++i)
            std::swap(permutationTable[i], permutationTable[diceInt() & tableSizeMask]);
        // extend the permutation table in the index range [256:512]
        for (unsigned i = 0; i < tableSize; ++i) {
            permutationTable[tableSize + i] = permutationTable[i];
        }
    }
    virtual ~PerlinNoise() {}

    /* inline */
    int hash(const int &x, const int &y, const int &z) const
    { return permutationTable[permutationTable[permutationTable[x] + y] + z]; }

public:
    float eval(const Vec3f &p) const
    {
        int xi0 = ((int)std::floor(p.x)) & tableSizeMask;
        int yi0 = ((int)std::floor(p.y)) & tableSizeMask;
        int zi0 = ((int)std::floor(p.z)) & tableSizeMask;

        int xi1 = (xi0 + 1) & tableSizeMask;
        int yi1 = (yi0 + 1) & tableSizeMask;
        int zi1 = (zi0 + 1) & tableSizeMask;

        float tx = p.x - ((int)std::floor(p.x));
        float ty = p.y - ((int)std::floor(p.y));
        float tz = p.z - ((int)std::floor(p.z));

        float u = smoothstep(tx);
        float v = smoothstep(ty);
        float w = smoothstep(tz);

        // gradients at the corner of the cell
        const Vec3f &c000 = gradients[hash(xi0, yi0, zi0)];
        const Vec3f &c100 = gradients[hash(xi1, yi0, zi0)];
        const Vec3f &c010 = gradients[hash(xi0, yi1, zi0)];
        const Vec3f &c110 = gradients[hash(xi1, yi1, zi0)];

        const Vec3f &c001 = gradients[hash(xi0, yi0, zi1)];
        const Vec3f &c101 = gradients[hash(xi1, yi0, zi1)];
        const Vec3f &c011 = gradients[hash(xi0, yi1, zi1)];
        const Vec3f &c111 = gradients[hash(xi1, yi1, zi1)];

        // generate vectors going from the grid points to p
        float x0 = tx, x1 = tx - 1;
        float y0 = ty, y1 = ty - 1;
        float z0 = tz, z1 = tz - 1;

        Vec3f p000 = Vec3f(x0, y0, z0);
        Vec3f p100 = Vec3f(x1, y0, z0);
        Vec3f p010 = Vec3f(x0, y1, z0);
        Vec3f p110 = Vec3f(x1, y1, z0);

        Vec3f p001 = Vec3f(x0, y0, z1);
        Vec3f p101 = Vec3f(x1, y0, z1);
        Vec3f p011 = Vec3f(x0, y1, z1);
        Vec3f p111 = Vec3f(x1, y1, z1);

        // linear interpolation
        float a = lerp(dot(c000, p000), dot(c100, p100), u);
        float b = lerp(dot(c010, p010), dot(c110, p110), u);
        float c = lerp(dot(c001, p001), dot(c101, p101), u);
        float d = lerp(dot(c011, p011), dot(c111, p111), u);

        float e = lerp(a, b, v);
        float f = lerp(c, d, v);

        return lerp(e, f, w);  //g
    }
};
Note that in this implementation, the array gradients has size tableSize. This is not the case in Perlin implementation. It has size tableSize * 2. This is because, in his original implementation, the hash function he used was:
return permutationTable[permutationTable[x] + y] + z;
Which returns values between 0 and tableSize * 2. Any lookup into permutation[] will return a value in the range 0 to tableSize. Since we add z to it, which is itself in the range 0 to tableSize, then the resulting number is indeed in the range 0 to tableSize * 2 since we use this number as an index in the array gradients, gradients needs to have a size of tableSize * 2. However, in our implementation, we use the hash function:
return permutationTable[permutationTable[permutationTable[x] + y] + z];
This return a value in the range 0-tableSize. It's a detail but worth mentioning.
As usual, to interpolate the values at the corners of cells smoothly, we use the smoothstep function (to remap tx, ty, and tz into u, v, and w, respectively - lines 55 to 57).
As you can see, this is very similar to the value noise function. We just replaced the random values at the corner of the cells with a dot product between a random direction and the directions from the corners of the cell to P (lines 86 to 89).
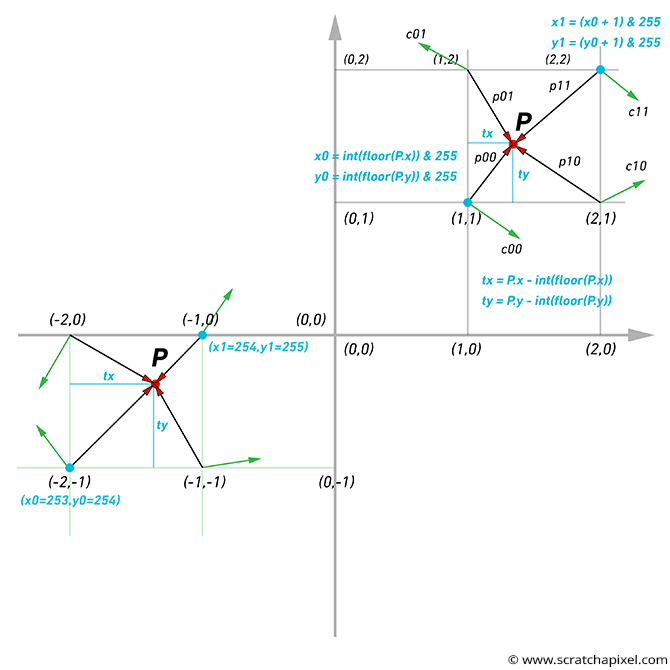
Getting the code right is not easy. There are a couple of traps we need to be careful about. Now, the image above helps you (hopefully) figure out what's happening (it only represents the 2D case, though). Note the "gradient vectors" at the corners of the grid cell and how we compute the vectors from the corners of the cell to the point where we compute the noise function. Note also that:
-
You need to use the code
(int)(floor(P.x)) & 255to compute the lower left corner of the grid cell x-coordinate (for the y-coordinate, replace P.x with P.y). The question is, why use thefloorfunction (which is a function from the stl C++ library)? This is useful when the value of any point coordinates is negative. The problem withint(P.x)is that it returns 1 if the value of the coordinate is 1.1 or 1.999, for instance (which is good), but it returns -1 when the value is -1.2 or -1.999 when what we want in this particular case is -2. Keep in mind that the smallest coordinates of the grid cell the point is in should always be in the lower left corner of the cell, whether the cell is on the positive or negative side of the world Cartesian coordinate system axis, as shown in the image above. Using the functionfloor(P.x)guarantees that we get the correct result regardless of the coordinate sign. Indeed(int)(floor(-1.2)), for example, returns -2, which is what we want. -
Once we have computed the lower-left coordinate of the grid cell, then we need to calculate its upper-right coordinate as well. We can do this by simply adding 1 to the lower left coordinate, but this value might exceed the grid size (256); thus, we also need to take the modulo of this value to ensure that the grid coordinates stays within the range [0,255].
X0 = (int)(std::floor(P.x)) & 255;
Y0 = (int)(std::floor(P.y)) & 255;
X1 = (X0 + 1) & 255;
Y1 = (Y0 + 1) & 255;
-
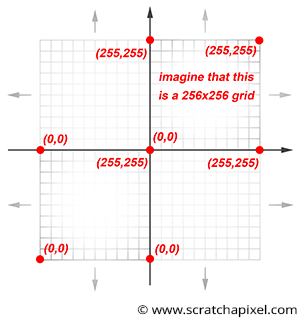
Again, remember that the size of the gradient array is limited (256 values). We explained that one way of visualizing the process is to imagine a 3D grid whose vertices are assigned random gradients. Yet the noise function works for values of x, y, and z, which are infinite (the grid dimensions are finite, but not the coordinates of the point used to compute the noise function). So you can also see the noise function as a repetition of this 3D grid in every direction, as shown in Figure 2. What this means in practice is that when a point is located in the upper right corner of that grid (which happens, for instance, when any of the coordinates of the point are in the range ]0,-1], ]-255, -256], [255, 256[, etc.), then we will interpolate between the gradient stored on the grid at the coordinates (255, 255) and the gradient value stored on the grid at the coordinates (0,0). Example:
X0 = (int)(-1) & 255; // = 255 (right corner of the 3D lattice or last cell)
X1 = (X0 + 1) & 255; // 0 (left corner of the 3D lattice of first cell)
-
The dot product returns values in the range [-1,1] (assuming the vectors involved are normalized). So, the Perlin noise function will also return negative and positive values. We get negative values when the direction at the corner of the cell and the vector from the corner of the cell to P points in opposite directions (as shown in Figure 1).
-
Finally, the vector V from the corner of the cell to P is, of course, (0,0,0) when P lies precisely on that corner. So the dot product of the gradient at that corner and V, in this case, is necessarily 0. This is visible in the image below, where we superimposed the lattice over the result of the noise function. Because the Perlin noise function returns values in the range [-1,1], we had to remap them in the range [0,1] to save the result out to an image, which means that the noise at the corner of each cell, once remapped is 0.5 (but before remapping it would be 0 - Figure 3).

Uniform Distribution of Gradients
Now, generating random directions uniformly distributed (they all have an equal probability of being generated) seems simple, but getting it right is trickier than it seems. The "naive" technique we just used generates random directions, but these directions are not uniformly distributed. They generate random directions within a cube's volume, not within a sphere's volume. For this reason, they are not uniformly distributed on the sphere. Another naive technique consists of randomly generating spherical coordinates \(\phi\) and \(\theta\) and convert these spherical coordinates to Cartesian coordinates:
float phi = 2 * drand48() * M_PI;
float theta = drand48() * M_PI;
float x = cos(phi) * sin(theta);
float y = sin(phi) * sin(theta);
float z = cos(theta);
Though as elegant as this might sound, this doesn't work either. When you generate random spherical coordinates, these coordinates are nicely distributed within the space or domain within which these coordinates are defined. That is \([0,2\pi]\) for \(\phi\) and \([0,\pi]\) for \(\theta\). Though when you wrap this nice rectangle onto a sphere, you can see that the rectangle is being squeezed in at the sphere's poles. In other words, the points nicely distributed over the surface of the rectangle are now cluttered around the poles (image below). The density of points at the pole is now greater than anywhere else on the sphere, and we can see that this distribution is thus not uniform.
Remember that what we are trying to solve here is the creation of random unit directions uniformly distributed, which to some extent is the same problem that the one we already studied in the lesson on Path Tracing in which we learned how to create random samples over the hemisphere. We went through many details in this lesson, so that we won't explain the process again. Remember that to sample a function, we first need to compute the PDF of that function, then its CDF, and finally, the invert of the CDF. In our particular case, we want to create samples over a sphere, but like the hemisphere example, we will start with a solid angle to express our probability function or PDF. As you (hopefully) know, there are \(4\pi\) steradians (the unit for solid angle) in a sphere (if you are unfamiliar with the concept of solid angle, please check the lesson on radiometry in Mathematics and Physics for Computer Graphics section). We also know that a PDF integrates to 1. So in the case of the sphere, we can write:
$$\int_0^{4\pi} p(\omega)dw = 1.$$If you follow the steps described in the lesson on Global Illumination, you get the following:
$$p(\omega)= { {1} \over {4\pi} }.$$Note the difference with the hemisphere whose PDF was \({1} \over{2\pi}\)
As in the other lesson, we want to express that PDF in terms of polar coordinates (\(\theta\) and \(\phi\)):
$$p(\phi, \theta)d\phi d\theta = p(\omega)d\omega.$$Then recall that the differential solid angle \(d\omega\) can also be defined as (again, this is explained in the other lesson):
$$d\omega = \sin \theta d\phi d\theta.$$If we substitute this equation in the previous equation, we get:
$$ \begin{array}{l} p(\phi,\theta)d\phi d\theta = p(\omega) d\omega,\\ p(\phi,\theta) d\phi d\theta = p(\omega) \sin \theta d\phi d\theta. \end{array} $$The \(d\phi d\theta\) terms on each side of the equation cancel out, and we get:
$$ \begin{array}{l} p(\phi, \theta)=p(\omega) \sin \theta,\\ p(\phi, \theta)= { \dfrac { \sin \theta} {4 \pi}}. \end{array} $$Let's then integrate \(p(\phi, \theta)\) with respect to \(\phi\) as explained in the lesson on global illumination. We get:
$$ p(\theta)= \int_\phi^{2\pi} p(\phi, \theta) d \phi = \int_\phi^{2\pi} { \dfrac { \sin \theta} {4 \pi}} d \phi = 2\pi * { \dfrac { \sin \theta} {4 \pi} } = { \dfrac { \sin \theta} {2}}. $$For the PDF of \(\phi\) we get:
$$ p(\phi) = { \dfrac { p(\phi, \theta) } { p(\theta) } } = { \dfrac { \dfrac { \sin \theta} {4 \pi} } {\dfrac { \sin \theta} {2} } } = {\dfrac {1}{2\pi}}. $$Now that we have the PDFs for \(\phi\) and \(\theta\), we need to compute their respective CDFs and inverse them:
$$Pr(X \le \theta) = P(\theta) = \int_0^\theta p(\theta) d\theta = \int_0^\theta { \dfrac { \sin \theta} {2}} d\theta.$$Using the Fundamental Theorem of Calculus, we get the following:
$$\int_0^\theta { \dfrac { \sin \theta} {2}} d\theta = \big [ {\dfrac {-\cos \theta}{2}} \big ]_0^{\theta} = \big [{\dfrac {-\cos \theta}{2 }} -- { \dfrac {\cos 0 } {2} } \big ] = {\dfrac {1}{2}} - {\dfrac {\cos \theta}{2}}.$$The CDF of the \(p(\phi)\) is simpler:
$$Pr(X \le \phi) = P(\phi) = \int_0^\phi {\dfrac {1}{2\pi}} d\phi = {\dfrac {1}{2\pi}}[\phi - 0] = {\dfrac {\phi}{2\pi}}.$$Let's finally invert these CDFs:
$$ \begin{array}{l} \xi = {\dfrac {1}{2}} - {\dfrac {\cos \theta}{2}}\\ {\dfrac {\cos \theta}{2}} = {\dfrac {1}{2}} - \xi\\ \cos \theta = 1 - 2\xi\\ \theta = \cos^{-1}(1 - 2\xi) = \cos^{-1}(2\xi - 1). \end{array} $$Note that \(2\xi - 1\) where \(\xi\) (the Greek letter xi) is the random number (uniformly distributed) in the range [0,1] and \(1 - 2\xi\) gives the same results.
And for \(\phi\):
$$ \begin{array}{l} \xi = {\dfrac {\phi}{2\pi}}\\ \phi = 2 \pi \xi. \end{array} $$Where \(\xi\), the Greek letter xi, represents a uniformly distributed random number in the range [0,1]. In other words, to generate uniformly random points over the surface of the sphere, you need to use the following code:
unsigned seed = 2016;
std::mt19937 generator(seed);
std::uniform_real_distribution<float> distribution;
auto dice = std::bind(distribution, generator);

float theta = acos(2 * dice() - 1);
float phi = 2 * dice() * M_PI;

float x = cos(phi) * sin(theta);
float y = sin(phi) * sin(theta);
float z = cos(theta);
Other methods exist. But we will be using this one in the code of our Perlin noise function.
for (unsigned i = 0; i < tableSize; ++i) {
    float theta = acos(2 * dice() - 1);
    float phi = 2 * dice() * M_PI;

    float x = cos(phi) * sin(theta);
    float y = sin(phi) * sin(theta);
    float z = cos(theta);
    gradients[i] = Vec3f(x, y, z);
    permutationTable[i] = i;
}
The Perlin noise (right) in the following image generally feels better looking than the value noise (left). So the question is now to explain why this is the case.

Why Is Perlin/Gradient Noise Better Than Value Noise?
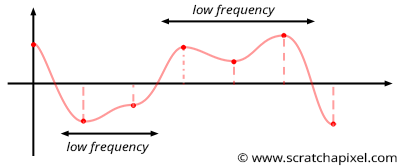
It is easier to understand why Perlin noise is better than value noise in 1D. In the case of value noise, we generate random values at integer positions along the "line" and interpolate these values between these integer positions (as shown in Figures 5 and 6). Though note that we choose these values randomly, several successive values may be very similar (as illustrated in Figure 6). This is not great because some parts of the noise will vary quickly (when consecutive values are very different from each other), and some parts will change slowly (when successive values along the x-axis are similar: for example, have the same sign). Parts of the noise function where values change slowly are said to have a low frequency compared to parts of the noise where the values change quickly, which are said to have a higher frequency. This generally means that value noise (when you check the frequencies the noise is made of) is composed of high and low frequencies. A good noise is a noise that looks random and changes smoothly locally but also generally presents a pretty homogeneous look. In other words, the features the noise is made of should generally have a similar size (a similar frequency). That's not the case for the value noise for the reason we just explained.
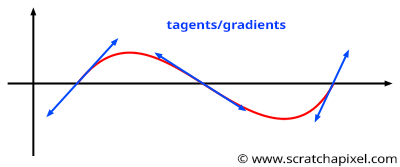
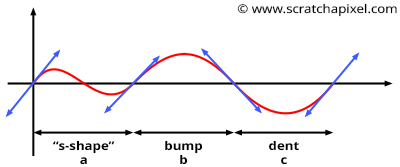
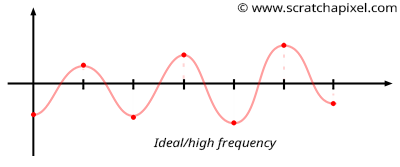
The Perlin noise technique is very similar to the value noise algorithm though rather than selecting random values at integer positions along the line, we choose "gradients". Gradients can be seen as "tangents" to the 1D noise function at the lattice points. As you can see in Figures 7 and 8, it doesn't matter in which direction the gradient points because if it causes the curve to go up on one side of the lattice point (say on the right of a lattice point as shown in Figure 8), it causes the curve to go down on the other side of that same point (say on the left of that point). In the worse case, if two successive lattice points have gradients that aim at radically opposite directions (one points up and the other points down), then the noise function will have an "S" like shape between the two points (as shown in Figure 8a). In the other case, the curve will either go up or down (Figure 8b and 8c). But one can easily see that because of this construction, all features have more or less the same size. It's either a bump or a dent or an "S" like shape between two consecutive lattice points. As a result, the distribution of frequencies in the Perlin noise is more regular than the value noise's frequency spectrum (in particular, it removes the low frequencies you can find in the latter). As Perlin notes in his paper:
The above texture has a band-limited character; there is no detail outside a certain size range.
This is an important property, especially when it comes to filtering the function (check the lesson on filtering).
References
An Image Synthesizer. Ken Perlin (1985)