Introduction to Statistics
Reading time: 6 mins.Introduction to Statistics
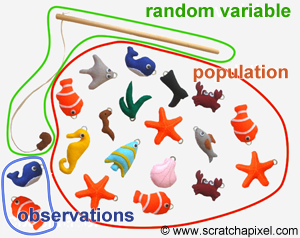
Consider the experiment in which we randomly pick cards from a set of 10 cards labeled with a number that can either be 0, 1, or 2. In statistics, these 10 cards form what we call a population. The population generally refers to the entire collection of things (in our example the 10 cards) from which we may collect data. Let's say that each time we pick a card we put it back in the set so that we always draw a card from a complete set of 10 cards (something which in statistics, is called drawing with replacement). Because the process of picking up a card is "random", we can't predict what that number will be ahead of time but we know it will either be 0, 1, or 2. Let's also consider that we don't know anything about the probability distribution corresponding to that experiment. In other words, we don't know how many cards in the set of 10 cards have the number 0, 1, or 2. To summarize we don't know anything about the random variable produced by this experiment besides the fact that it returns numbers between 0 and 2, and we don't know anything about the probability distribution of these numbers, thus we can't use probability calculations to estimate the chances to pick up a 0 or a 2. But can we guess? The answer is yes, and this is precisely the goal of statistics.
The goal of statistics is to provide information on random variables and probability distributions we don't know anything about in the first place. How? By the mean of collecting data about a property of a population such as the height of the adult population of a given country for instance. Why would we do this in the first place anyway? Generally, because the population is way too large (even sometimes infinite) to measure this property using every single element in the population. Note that in statistics, the property of the population we are interested in is called a parameter. Height, weight, hair color, income, and the number of children can all be considered as parameters of our Bahamian population.
The process of collecting data is central to the principle of statistics: the idea is that by randomly selecting elements from the population (with our fish line), we "hope" to get a smaller "version" of the entire population on which it becomes easier to perform some measure (because the set of selected elements is smaller). By "randomly" we mean that the process by which we select elements in the population, doesn't give more importance to some elements than others. If it was the case we would introduce what we call bias in the calculation of this estimate, something we will talk about again in great detail later in this lesson. Generally, bias is not a good thing. By "hope" we don't mean to say that the process of getting a sample or subset of the population that represents the entire population is just a matter of luck. We can mathematically prove (or maybe validate is more accurate to say) that the method by which we estimate a population parameter from a subset of that population is likely to provide us with a result reasonably close to the "exact" population parameter itself. Of course, a subset of the population is not the population, thus any measure we will do from that subset is likely to have some level of variation compared to the same value computed from the entire population. This variation depends on parameters such as the sample size for instance or the degree by which the parameter itself varies in the population (for the same sample size, the higher this variation the less likely we are to get a good estimate), but we will show in this lesson that in many cases, the method gives pretty good estimates even with reasonably small sample sizes (in the order of 10 to 20 samples). Election polls are a familiar example of how and where statistics are used. Note that the idea of a poll or using statistics to estimate who is likely to win an election is of course about making the most accurate estimate as possible, but also to somehow measuring the accuracy of this estimate. We will talk more about this later.
The goal of statistics thus is really to obtain information about a property or parameter of this population without considering every single element in the population and we do this generally when it is impossible or impractical to collect information about the entire population. Hopefully, you can see the pieces of the puzzle coming together now. Our random variable is some sort of "sampler", it's a tool or a function on the population, that we can use to collect data on that population (like a fish line), and the collected data makes up what we call the observations and the group of observations itself is what we call a sample or statistics. Finally, statistical theory provides a range of techniques that can be used to infer information from that data, notably about three things: a mean for the property we try to measure from that population (what is the average height of the adult population in the Bahamas), the way this property is distributed across the population (from which we can infer its probability distribution), and a sense of the degree by which this property varies across the population.
This introduction is far from giving you a complete view of statistics. Let's just say for now that it gives you the main idea which is that statistics is used when we want to get some information on a parameter of a population that we ignore everything about in the first place. In this chapter we will introduce you to the concept of expected value, variance, and standard deviation but in the following chapters, we will introduce you to other very important concepts of statistical theory notably the concept of sample, estimator and sampling distribution which is very useful in 3D rendering (and important to understand the Monte Carlo method). So keep reading!